A few years ago, we researched competitors' websites for a website localized in New York State. The main goal of the first phase was to find answers to two questions: 1) Were there any queries that could be taken from competitors for our website? and 2) How much content would need to be created to achieve a similar position in organic search and gain equal market share?
Here's a partial analysis of planar.com, which we made based on a visual study of search results and standard reports from the SEO tool Semrush. The report describes the website's quantitative, qualitative, and technical indicators, while its form differs from the service's standard one.
So why don't we give our clients service's standard SEO reports, even though their email reports can be automated, which is so convenient? First, the numbers and dynamics of changes in the standard SEO report are challenging to interpret without understanding the correlations. Any report we make based on Semrush's competitor analysis, search query analysis, or any other service and its data always has comments from analysts describing various statistics. It makes the report — and most importantly, its conclusions — very clear for the customer.
As for the website described below, it's a rather large project in the field of LED video walls that deals with their production, sales, and leasing. Our customer wasn't a manufacturer but did have a similar product line intended primarily for local users in New York. Skipping ahead, we later created and optimized a separate project for the customer from scratch that was specific to the region and gathered more than 500,000 relevant Google impressions in a year. But that's a topic for a whole other article.
Semrush Competitor Analysis: The Competitor's Quantitative Indicators
Estimated website traffic
Visits from organic search
- 73%, with almost all visitors coming from Google
- The trend was growing (double the amount of visits in 2 years)
Main countries
- United States: 83%
- UK: 2.5%
- Canada: 1.2%.
The website is clearly localized for the US.
Total keywords in search results
Around 30,000.
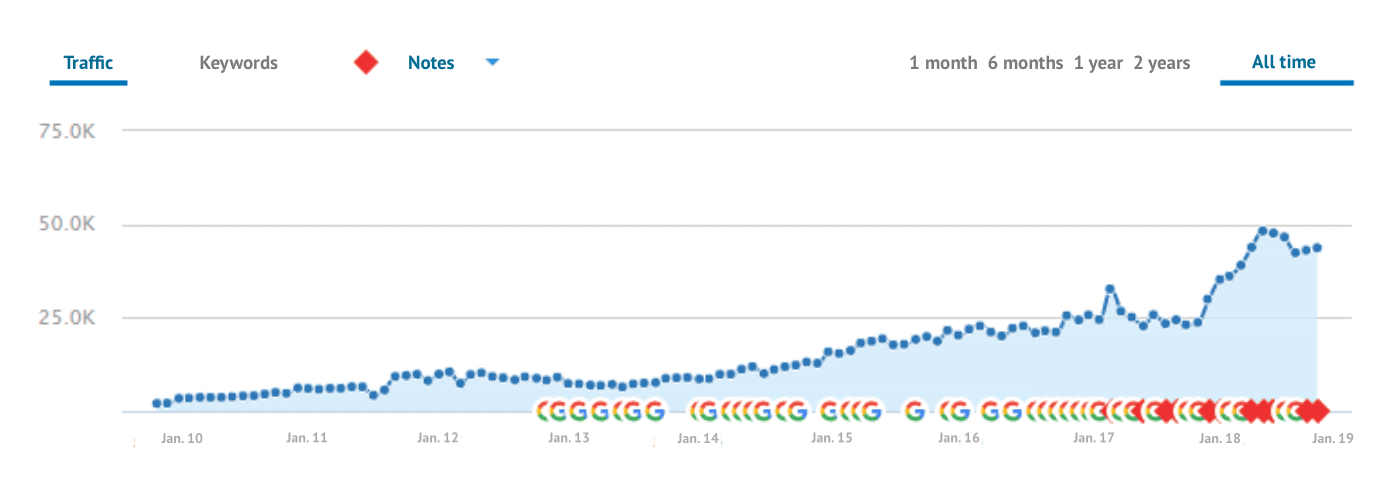
Keyword dynamics
As you can see in the graph, from January 2010 to January 2014, the search engine results showed a smooth increase in the number of website keywords. That was mostly due to the technical optimization of the website and, to a lesser extent, the growth in the website's content (an additional check of the website's history was performed). The stronger growth in keywords and traffic began in 2014 due to a large increase in content (pages in the main category header and blog posts).
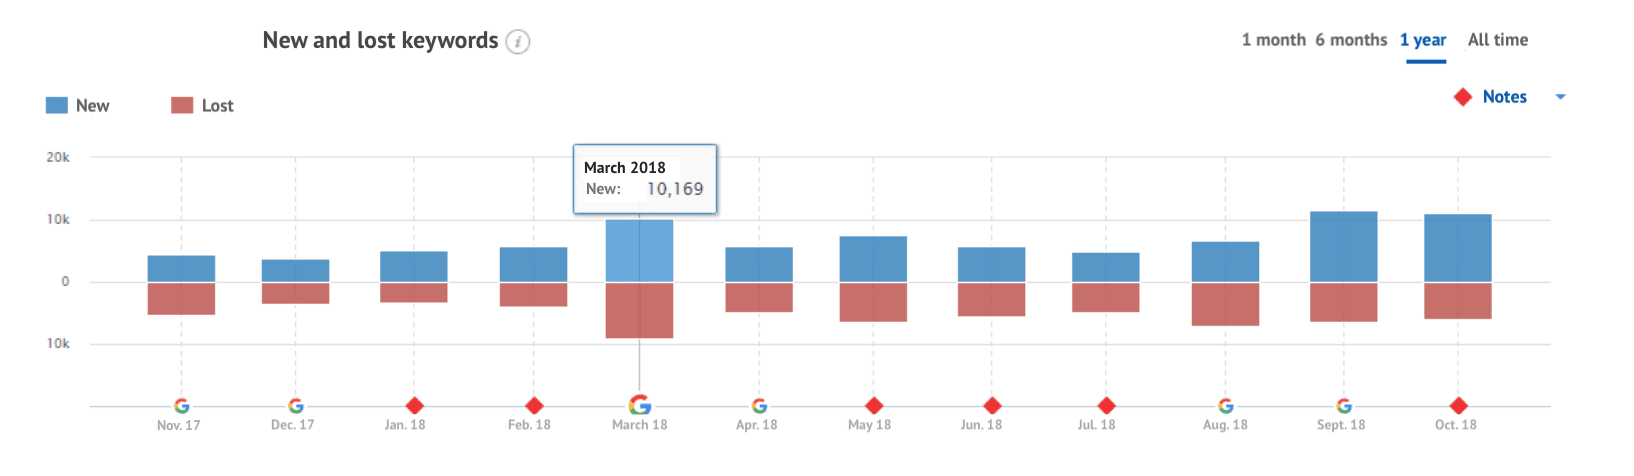
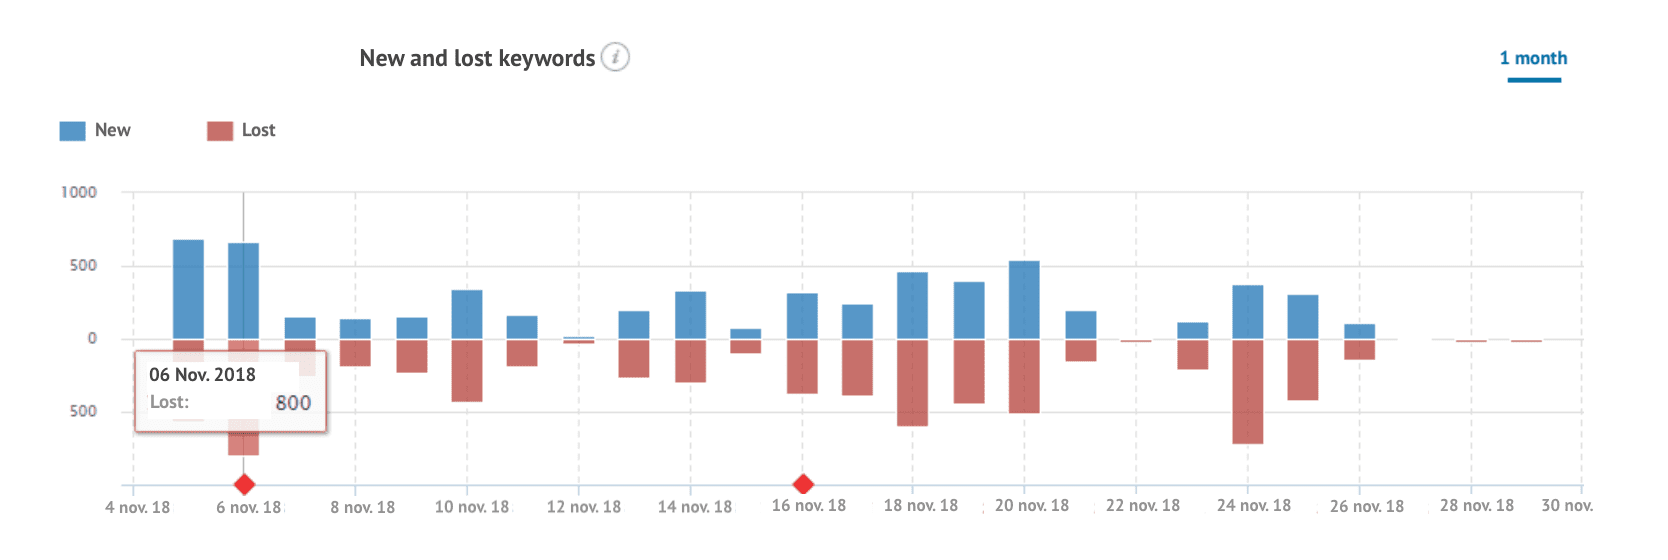
The new and lost keywords graph shows that the new queries and monthly loss growth dynamics were about the same. However, March stands out for both of these categories, while September and October saw a higher number of new keywords. It may indicate changes in Google ranking rules (March) and an increase in content relevance due to some factors from Google's point of view (September and October).
- In addition to that, a large number of keywords that 'jumped' in the search results could indicate a significant share of artificial queries in the top results (pages reach the top results, but people don't visit them using these queries, and the pages disappear).
- The share of artificial queries is estimated to be at around 20-30%.
Keywords share in search results
In the United States, this was around 56% (i.e., around half, given that website traffic is almost entirely from the US. However, the website was at the top of results for many queries in other regions. This may indicate that the website is localized in the US due to content but not artificially by Google).
Traffic dynamics
- When comparing indicators for 6 months and for 3 years, you can see that the website's traffic had a seasonal influence. The highest peaks came in the winter (December-February).
- However, in 2016, traffic was around 3 times lower.
- The current trend was growing.
- The average bounce rate didn't change.
Semrush Competitor Analysis: Qualitative Indicators
Bounces in 2018
- 50 to 70%, depending on the month
In general, this indicator was average for this kind of website but unstable, which may be due to different leading queries every month.
Average session length
- 3 to 6 minutes (high)
- In March, April, and August, the session length was around 2 minutes (given roughly equal traffic and an overall declining trend during these months).
This could indicate both seasonality and a change in leading queries.
Semrush Competitor Analysis: Technical Indicators
Indexing
The website has 3,570 pages indexed on Google.
Queries per page
Given the number of queries in the results (30,000), 1 page collects traffic from an average of 8 queries. Meanwhile, the estimate of queries in Google search results for the main page was around 400 keywords!
Keyword intersection
The website has the highest keyword intersection with the following websites:
- touchwindow.com: 536
- elotouch.com: 469
- necdisplay.com: 446
As you can see, the intersections are only around 1.6%, which is not much and may indicate the website's unique content strategy.
Blog
- Since January 2006, the website has had a blog with around 1,100 posts in 245 categories (i.e., that is now around 31% of the website's total links).
- The number of indexed blog posts is nearly the same as the number of blog entries on the website map (1,073), which indicates good-quality content.
- On average, around 10 pages per month are posted on the website (not including tag categories).
Blog posts format
- The blog posts are of various formats and lengths. Almost all of them are optimized by several queries.
- Each blog post features at least 1 large photo.
- They also used subheadings, lists, and cross references.
Internal links in blog posts
External links to the website
Around 2,000 domains reference the website. Some links are site-wide (on all pages), or one page may contain several links, which gives a large total number of links and anchors (around 4,000). However, almost all the links look natural. The following types of anchors are used:
1) Branded: leyard and planar's, lcd & led digital wall displays & signage solutions planar
2) URLs
3) Empty
4) Various phrases with token words: ultrares product line
5) Tail queries: ra-series lcd video walls
6) Long phrases with links to news: Planar will have a transparent OLED panel
7) General queries: display screens
Given their quantity and anchors, external links don't seem to be the main factor influencing the growth of positions but clearly strengthen many website pages. Furthermore, the external links are likely to have an 'unnatural' origin. Here's one of them: http://www.bgivb.com/make-custom-trade-show-exhibits-san-francisco/
Conclusions from the competitor analysis
- Over 500 competitor thematic queries can be added to the customer's website tree.
- If posting 1-5 materials a month on the customer's website by the collected semantic core, the cumulative effect of this work will be seen in around 6-18 months.
- If posting 1-5 materials a month, the growth of the number of keywords, positions, and traffic can be expected at least six months earlier.
- If focusing exclusively on creating a few category pages on the website, getting into the top 10 results and attracting traffic from search engines to these pages will be difficult. Getting to the top of queries is impossible, regardless of the amount of text on them, the occurrence of keywords, and other page factors.
Disclaimer: This is a report describing the data on the competitor's website based on the standard Semrush Competitor Analysis and Semrush Keywords Analysis reports. We proposed to provide the client with the second part of the report upon their request. It deals with search queries that led us to the conclusions above and answered the customer's questions.
Need the right SEO data interpretation? Alconost's experts can correctly interpret what you see on the charts of any SEO service, choose the right SEO services for you, ask the right questions, and find the answers to them. Contact us now! We optimize websites from scratch and handle large international projects! With Alconost, you'll never have to worry again about which SEO service is better: Semrush, Ahrefs, Moz, or any other!
Alconost is an internet marketing agency that offers search engine optimization for multilingual websites as well as PPC management, SMM and Content promotion. We conduct full SEO audits and website optimization, improve website usability, develop an international promotion strategy and analyze statistics and many others to increase your profits and improve your positions in search engines.
Services you can be interested in: